Choose your own adventure with FrogID
Fine-tuning citizen science to map frog species richness together.
Citizen science, the collection and analysis of data relating to the natural world by anyone with interest, has become an enormously popular hobby. With regular access to smartphones, it has never been easier to contribute an observation about the natural world through an app, to a rapidly growing global database of species distributions. Citizen science datasets are now some of the best and most extensive catalogues of species distributions. However, where participants live and when they have free time forms so much about what we can learn through citizen science. Missing data from some times and places would be super valuable puzzle pieces, helping us draw a more complete picture of where species live. Which is important if we want to understand and conserve them!
Recently, my colleagues and I - scientists at the Australian Museum and the University of New South Wales - attempted to understand not just why people contribute to the Australian Museum’s citizen science project FrogID, but what would motivate them to change when and where they contribute. We learned that FrogID users were overwhelmingly motivated by the aims of the project itself: to collect data on frogs that are useful to science and effective conservation. Importantly, participants said they were willing to change both where and when they contribute data to the project – if they knew it was important.
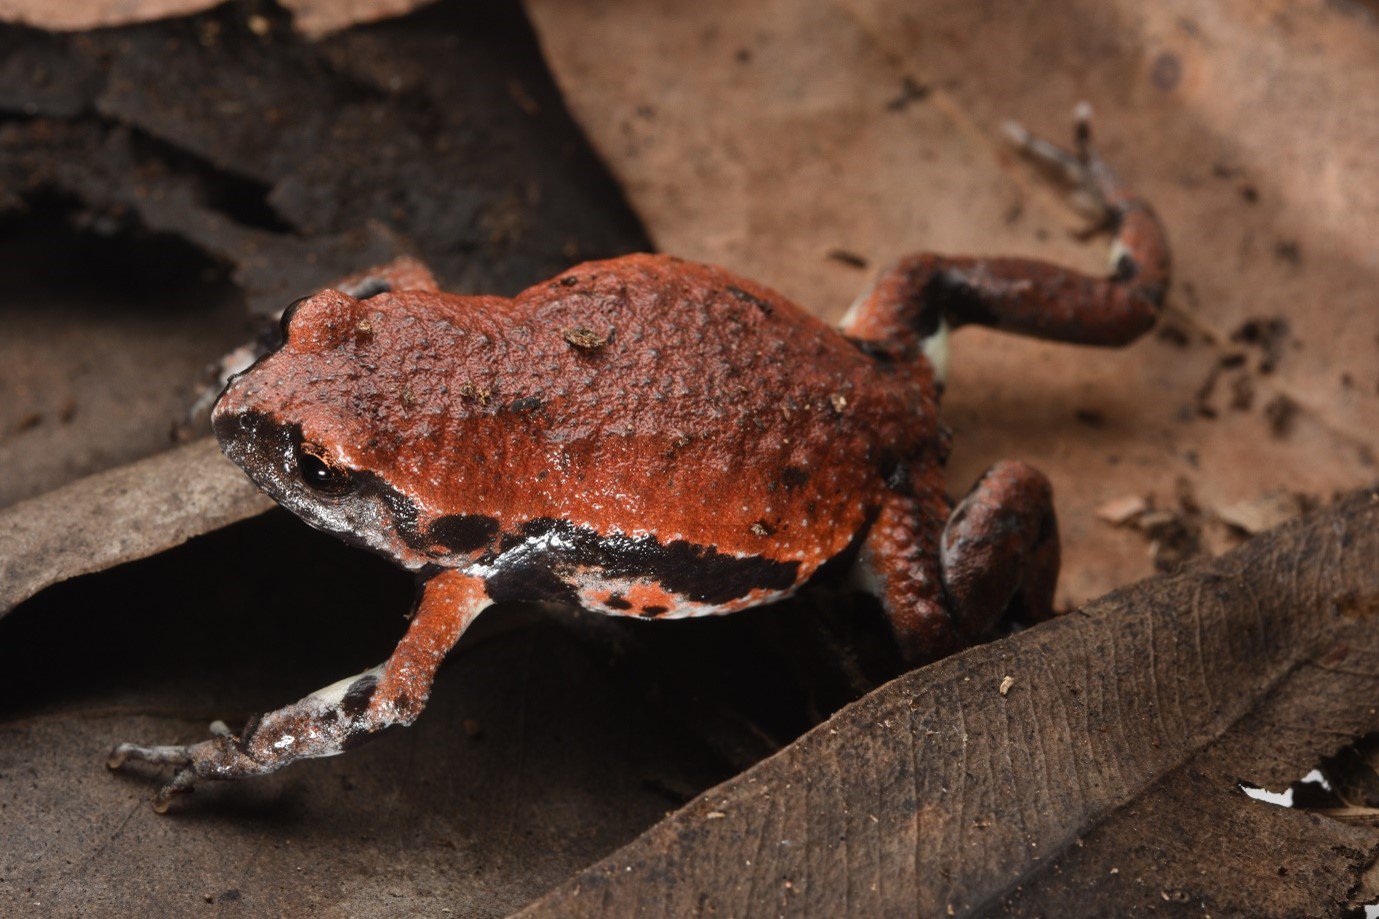
The small and cryptic Red-backed toadlet (Pseudophryne coriacea) near Kiwarrak State Forest, New South Wales.
Image: Jodi Rowley© Australian Museum
Seizing on this great feedback, we designed an experiment. We wanted to see if participants would collect records from the areas where we needed them the most, so we created a map of areas where we didn’t yet have enough records to understand frog species richness. Species richness is a simple measure of the number of unique species inhabiting a given area. FrogID submissions from each area range from 1 to 5 points – more points are assigned to the areas we most need frog records. Because estimates of species richness and sampling completeness changes as new information is added, we updated the maps every two weeks, refreshing the priority to reflect the number of recently contributed records.
We invited FrogID participants of four Local Government Areas (LGAs) in New South Wales to join the experiment, which ran from Spring 2020 to 2021. In addition to the colour-coded maps, members of two LGAs could see their local leader board – displaying the value of the records submitted by the top participants based on the points system described above. We sent reminder emails calling attention to the opportunity and updating readers on the project progress and priorities.
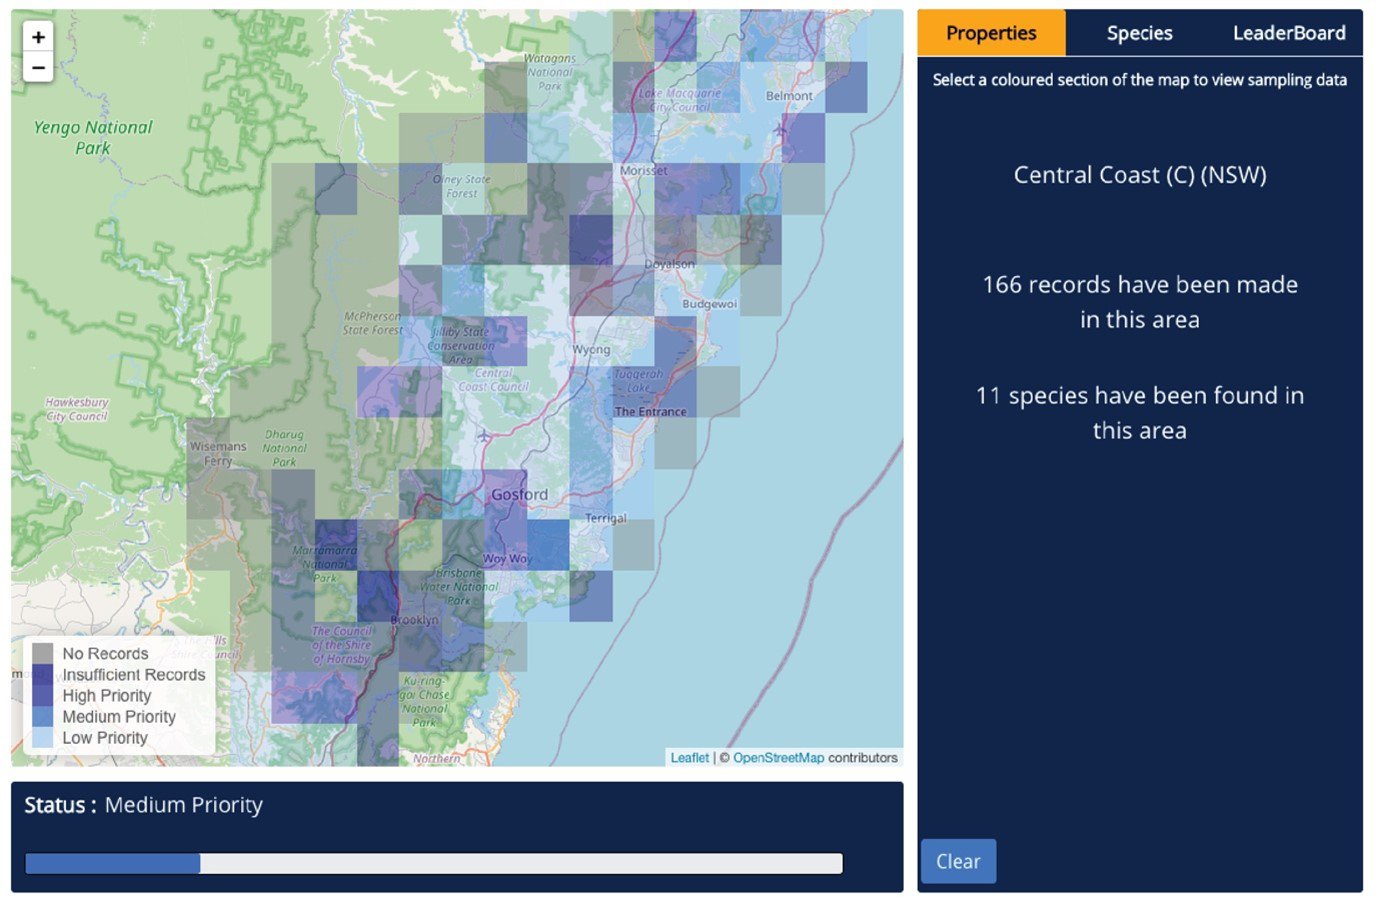
Example of a FrogID Priority Area Map for the Central Coast Local Government Area. Maps were interactive, allowing an investigation of FrogID records in each grid cell. Grey cells had no FrogID records, dark blue had insufficient FrogID records to know whether the cell was priority or not, and high, medium, and low priority cells are in increasingly paler blue.
Image: Corey Callaghan et al.© Corey Callaghan et al.
We found that FrogID participants used our maps to target high priority areas – just as we hoped! Over the year, people collected significantly fewer records in low priority spots and more records in high priority spots. This was even more pronounced in the LGAs with a local leader board, suggesting that game-like elements can make a difference in keeping people motivated. We know people have limited time and energy, and we appreciate that people really took the opportunity to make an impact.
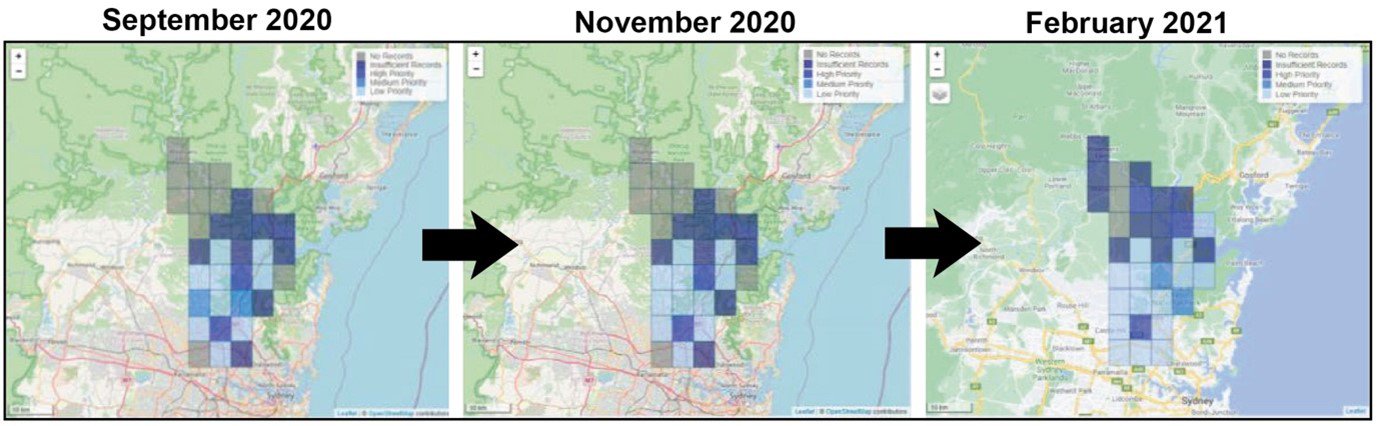
The FrogID Priority Map for the Hornsby Local Government Area over time. Over the course of the year, we saw many underrepresented areas get the attention they deserve through the efforts of FrogID participants, with increasingly fewer cells with no FrogID records (grey).
Image: Corey Callaghan et al.© Corey Callaghan et al.
This is the first time map-based “nudging” has been tested and demonstrated success with citizen science. This is great news for FrogID, and for other citizen science projects that want to improve their project through greater communication and resource sharing with participants. In our study, we picked gaining a better understanding of frog species richness as our aim, but these methods could be adapted to direct positive change towards other aims (like directing attention to areas that have received rainfall events or obtaining records of particular species). Together, we can make sure big data isn’t just bigger but better.
Maureen Thompson, Technical Officer, Herpetology; PhD Candidate Australian Museum Research Institute & UNSW Sydney.
More Information:
Callaghan, C.T., Thompson, M., Woods, A,, Poore, A.G.B., Bowler, D.E., Samonte, F., Rowley, J.J.L., Roslan, N., Kingsford, R.T., Cornwell, W.K., Major, R.E. (2023). Experimental evidence that behavioral nudges in citizen science projects can improve biodiversity data, BioScience, 73 (4) 302–313.https://doi.org/10.1093/biosci/biad012
Acknowledgements:
This project has been assisted by the New South Wales Government through its Environmental Trust. We would like to thank the Citizen Science Grants of the Australian Government and the Impact Grants program of IBM Australia for providing funding and resources to help build the FrogID App; the generous donors who have provided funding for the project including the Vonwiller Foundation; the Museum and Art Gallery of the Northern Territory, Museums Victoria, Queensland Museum, South Australian Museum, Tasmanian Museum and Art Gallery, and Western Australian Museum as FrogID partner museums; the many Australian Museum staff and volunteers who make up the FrogID team; UNSW for the University International Post Graduate Award, and, most importantly, the thousands of citizen scientists across Australia who have volunteered their time to record frogs. And thanks to everyone who participated in our experiment! CTC was supported by a Marie Skłodowska-Curie Individual Fellowship (no. 891052). This research was approved by the UNSW Human Research Ethics Approval Committee, project no. HC200727.
